
Activity: Linear Perspective
Painting Distance with Size
Observe and measure the change in the apparent size of an object as it moves away to create realistic perspective like Leonardo.
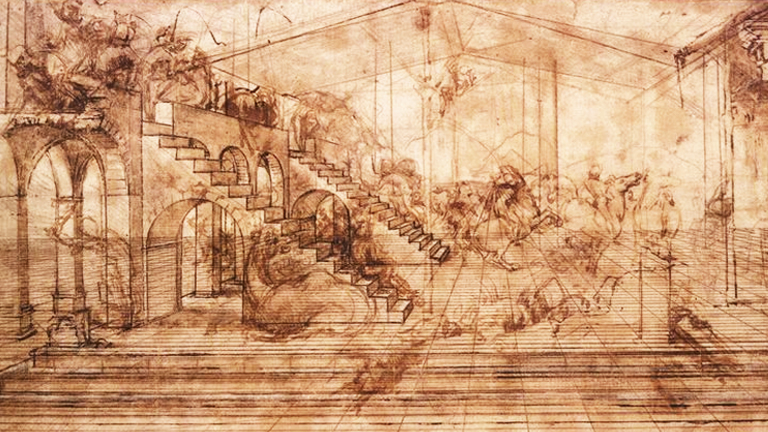
Leonardo's Perspective
"The most praiseworthy form of painting is the one that most resembles what it imitates" - Leonardo da Vinci
Look around you! People and objects look larger when they are nearby and smaller when they are far away. But how can we realistically capture this on a canvas?
During the Renaissance in Italy, architects and artists investigated the question of how to draw three dimensional objects on flat surfaces. They began to think of a painting as an "open window" through which the viewer sees the painted world.
Painter and architect Leon Battista Alberti wrote an influential book in 1435 that included a system of mathematical rules known as linear perspective to help painters achieve their goal of realism. Leonardo da Vinci probably learned Alberti's system while serving as an apprentice to the artist Verrocchio in Florence.
What is linear perspective?
Linear perspective is a mathematical system for creating the illusion of space and distance on a flat surface. To use linear perspective an artist must first imagine the picture surface as an "open window" through which to see the painted world. Straight lines are then drawn on the canvas to represent the horizon and "visual rays" connecting the viewer's eye to a point in the distance.
The horizon line runs across the canvas at the eye level of the viewer. The horizon line is where the sky appears to meet the ground.
The vanishing point should be located near the center of the horizon line. The vanishing point is where all parallel lines (orthogonals) that run towards the horizon line appear to come together like train tracks in the distance.
Orthogonal lines are "visual rays" helping the viewer's eye to connect points around the edges of the canvas to the vanishing point. An artist uses them to align the edges of walls and paving stones.
Classroom Activity
Lesson Plan
Main Idea: Students will use a simple set up to measure the change in the apparent size of an object as it moves away from them.
Learning Objectives: Observe how the height of an object appears to decrease as it moves away. Measure the apparent height of an object at several distances as it moves away. Graph the relationship observed. Describe and communicate a mathematical rule for the size-distance relationship.
Time: 30 – 45 minutes
Materials: Each 2-person team will need: scissors, a 3 x 5 card, a pencil, a strip of stiff cardboard at least 1 foot long, a table at least 4 feet across, a simple object such as a bottle or box 10-12 inches tall, a tape measure, an easy to read ruler with quarter inch divisions, a copy of the Data Sheet
Teaching Tip: Skills needed for this activity include accurate measuring (to the nearest 1/4 inch), converting common fractions to decimals, and graphing.
Procedure:
- Measure and cut out a square with 1/2 inch sides from near the middle of one end of the index card.
- Fold the index card lengthwise along the bottom of the square hole, then open the fold to a right angle.
- Tape the folded card to the end of the cardboard strip aligning the hole with the right edge of the strip. Make sure the tape does not block the hole.
- Measure the actual height of the object to the nearest 1/4 inch and record it in decimal form.
- Stretch out a tape measure across a table so that 0 inches is even with the near edge of the table. Use tape to secure the tape measure in place.
- Place the viewer at right angles to the table edge and aligned with the tape measure. Make the index card stick out exactly 10 inches. Secure the viewer with tape.
- Sit or kneel on the floor and put one eye next to the hole in the viewer.
- Hold or prop the ruler vertically, 0 end down, at the edge of the table so you can read it through the viewer.
- Have your partner move the object 10 inches away along the tape measure. Look through the viewer and note where the top edge of the object now appears to be on the ruler. Using the Data Sheet, record this as the apparent height in decimal form.
- Move the object away to 20, 30, 40, 50 and 60 inches. View and record the apparent height at each location.
- Switch roles with your partner to collect a second set of data.
Results Analysis
Make a graph of distance away versus apparent height. Use your graph to make a prediction about the object's apparent height at a distance you did not test. Then check your prediction by actually making a measurement at that distance. Make a prediction from your graph about how far away your object would need to be to look one inch tall. If your table is long enough, test this prediction as well.
Divide the actual height by the apparent height for each distance. The result is a ratio you can use for comparison with other teams who used different sized objects.
Draw Conclusions
From your graph and/or ratios, describe the rule or relationship you found between the apparent height of the object and its distance away from you.